Building a Product Dashboard for Disney + Hotstar
We look at the Content Engagement & Cross-platform metrics that Disney+Hotstar team must obsess about
Disney + Hotstar is an OTT app that streams assorted entertainment content to viewers across India and Southeast Asia.
Hotstar’s biggest pull in India is their licenses to broadcast cricket. Hotstar holds exclusive broadcast rights to ICC tournament, including the World Cup and Champions Trophy. In addition, Hotstar holds the rights to BCCI matches - all Indian cricket team fixtures, both domestic & international.
In general entertainment, Hotstar has exclusive access to Disney’s unique IP - which includes Marvel, Star Wars & Pixar. The platform also broadcasts sister brand Star’s soap TV shows on their platform.
In November 2024, Disney-Star India & Viacom18 (owner of Jiocinema & Colors entertainment brands) agreed to merge operations. This merger gives Hotstar access to Reliance’s distribution muscle.
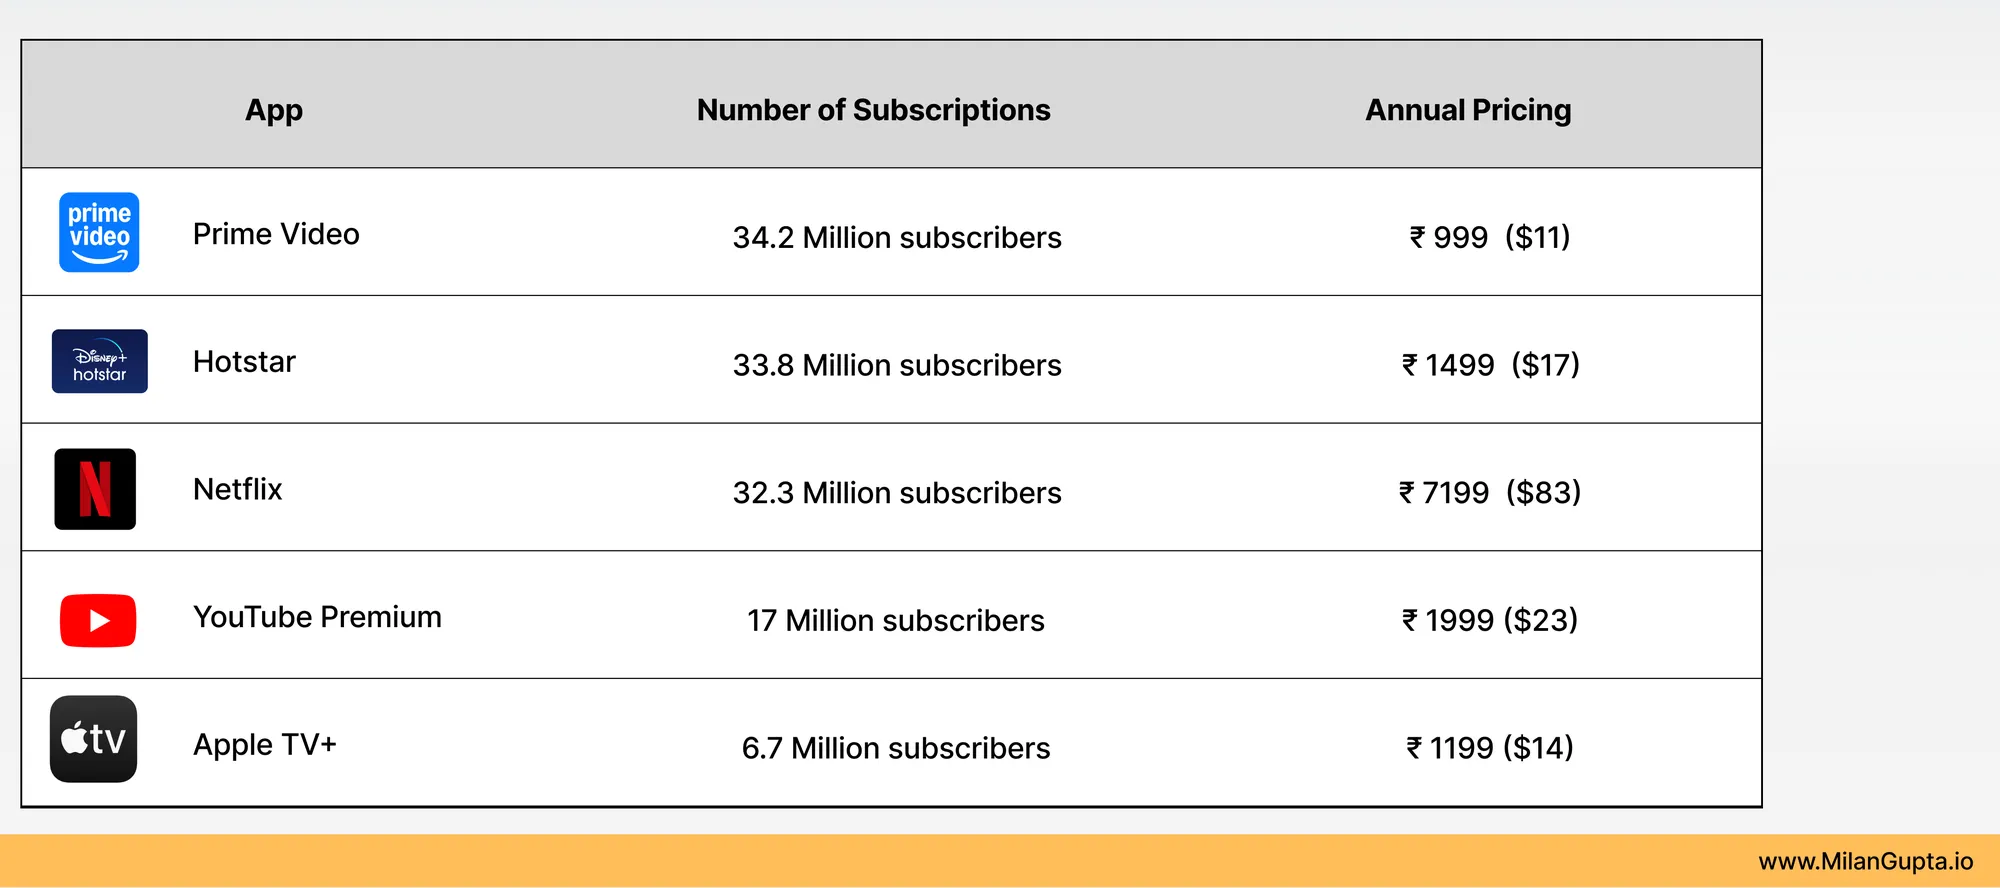
Disney + Hotstar has 2nd highest number of Paid Subscribers among OTT apps in India
Hotstar was the first OTT platform to emerge in India, launching in 2015. Hotstar was launched shortly before the 2015 Cricket World Cup, and IPL, for both of which they had acquired digital rights.
Disney+Hotstar has the 2nd highest number of paid subscriptions in India. Prime Video, which is bundled alongside Amazon Prime delivery service, has a total of 34.2 million subscribers in India.
At 33.8 million subscribers, Hotstar edges past Netflix’s 32.3 million subscribers in India.
(Netflix reports subscription stats for APAC at 57 million. Assuming that India’s 500mn strong internet population contributes to 50% of that number. Netflix is considerably more expensive than other competitors such as Hotstar, Prime Video & JioCinema, which is a critical factor in the cost-conscious Indian market).
Hotstar also has an ARPU of $1.05 - the contribution here comes from across subscription usage and advertising usage.
They have different types of customers amongst their base. Hotstar is looking to drive subscription revenue further, through a mix of acquisition strategies, retention strategies and in addition identify alternative revenue streams (say Ads for non-premium users)
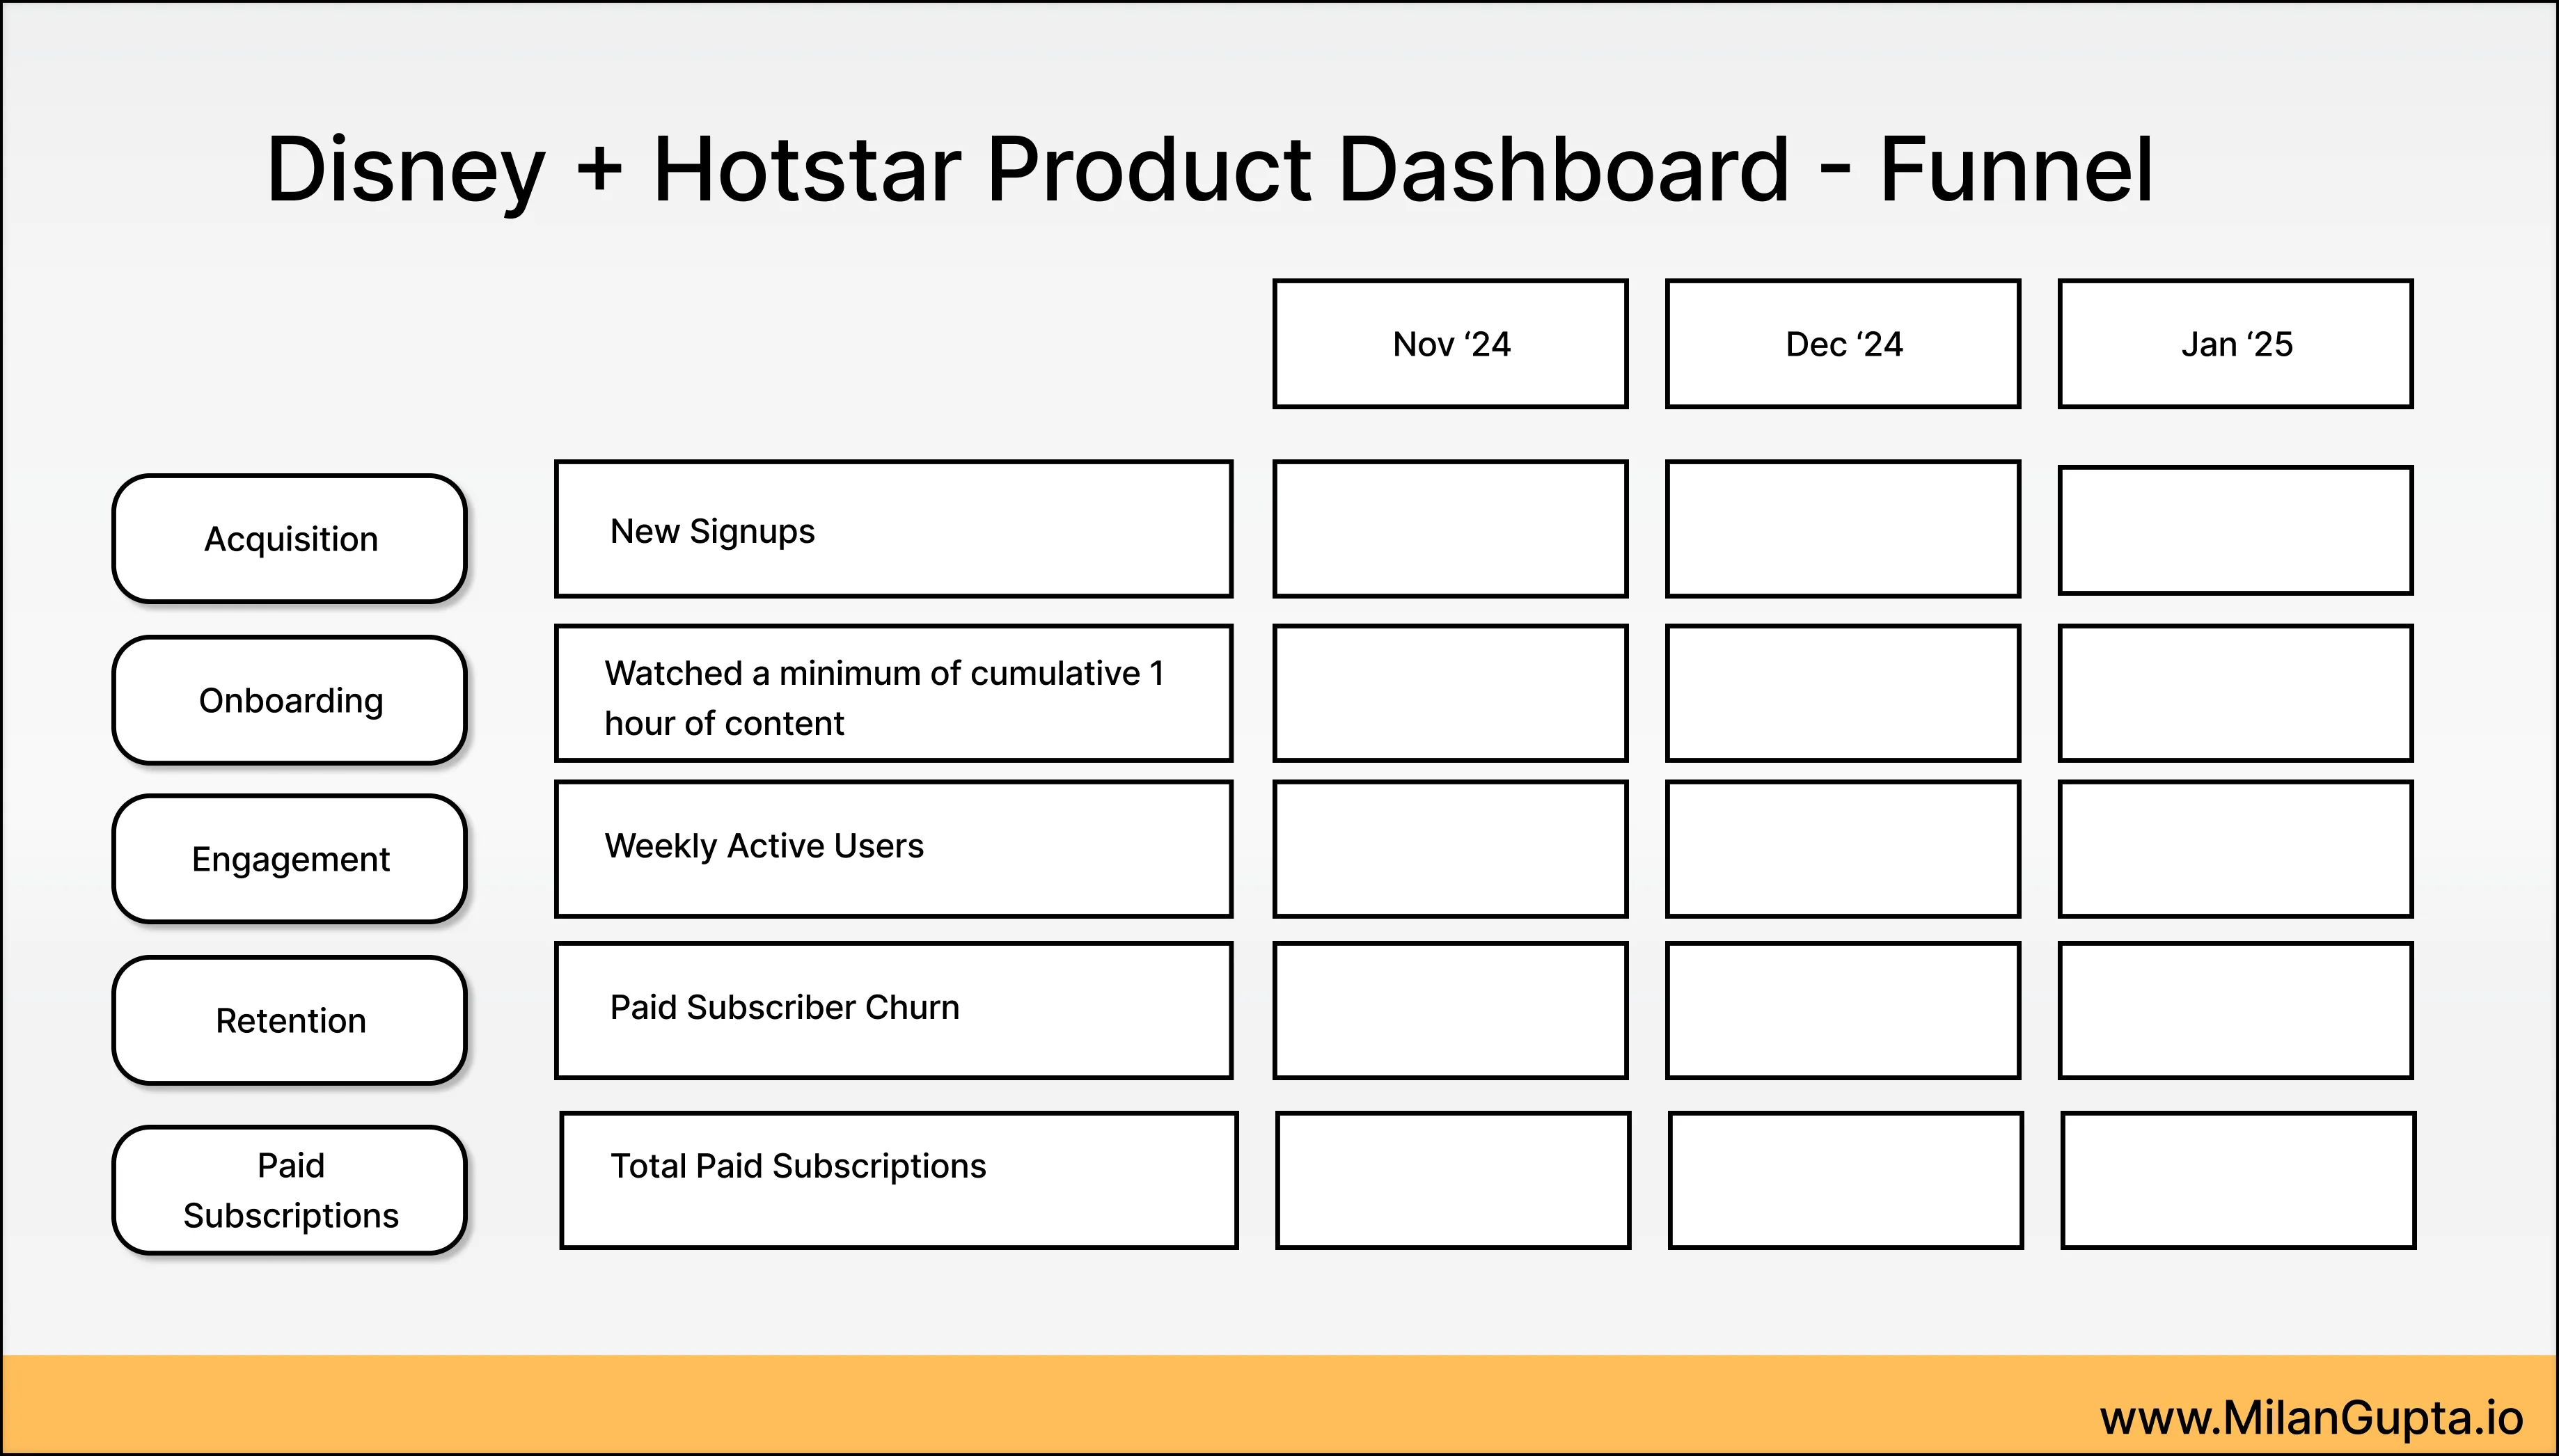
There will be 3 tracks along which we review metrics:
- Funnel metrics - Acquisition, Activation, Engagement, Retention & Conversion, referrals - Top metrics at different levels of the user funnel, from acquisition to revenue
- Content Engagement - how are users interacting with content; helpful in decisions regarding content, recommendations & search
- Segment-level metrics
- Platforms -
- Where are the customers viewing the content - are they viewing on Television, or on Mobile, or on PCs;
- What are the viewership patterns like
- Geography
- Content viewership groups
- Cohorts according to signing up
- Platforms -
Funnel Metrics
Acquisition
-
Customer Acquisition Cost (CAC) tracks marketing effeciency most effectively.
CAC is most effectively used in comparison to Lifetime value (LTV). The minimum LTV to CAC ratio for a consumer business starts at 3:1.
-
New Users acquired basically captures just how effective marketing team has been. This metric can be broken across
- New app installs across Android & iOS
- New account creation on Hotstar
Engagement
- Weekly Active Users (WAU) - This is the one metric that should be at the top of any Consumer PMs mind. WAU is a core health indicator of platform engagement.
In one number, it captures the overall user acquisition and retention effectiveness
It can be segmented by user cohorts (sports fans, movie enthusiasts, family viewers)
The reason why I have selected Weekly Active Users is that a week is the natural frequency for an OTT app. It does not offer the casual entertainment that Social Media such as Instagram provide. It is mostly viewed when customers have the time to watch content.
The Disney + Hotstar customer may be spending one day watching Netflix. Another day they will have Jiocinema on. And for movie night on Saturday, they go back to Disney + Hotstar.
Within the context of multiple choices competing for user’s time, a week is a good indicator of user’s engagement. (Having said that, I would still track DAUs to identify how many Core Users the app has)
- Advertising Revenue (for non-premium users) -
Advertising revenue reflects content partnerships (in-video ad placement) and programmatic ad insertions (marketplace model).
User segmentation is critical in advertising revenue, as ad packages are priced on the basis of how attractive customers are to potential advertisers.
For example, Cricket on IPL will have fairly low CPMs, as the audience is very diffuse.
On the other hand the (English) Premier League, with its English speaking fanbase, would have a higher CPM, reflecting the viewer’s higher affinity to purchase. To target those customers, Acko Insurance company has run a sticky campaign promoting their insurance products.
Retention
- Churn Rate indicates customer satisfaction and content relevance.
Ideal churn rate for OTT is <5% monthly
Like with every metric, segment analysis by content type, demographics and subscription tier are critical. Churn is a warning system for customer dissatisfaction, and needs to be treated as a key priority.
Revenue
- Subscriber Conversion Rate
This measures the effectiveness of converting free users to paid subscribers. This metric will inform decisions such as partnerships to acquire users through partner channels, or improved pricing models to capture customers who are looking to view specific product categories.
Here segmenting this by user segments according to content genres watched is important.
- Average Revenue Per User (ARPU) -
This is a direct indicator of financial health of the business. It tracks which subscription tiers are most effective.
It includes revenue from across multiple offerings - subscriptions and ads. While Hotstar does not have any addition Pay-per-view or additional Gated content, these may be further opportunities for the business.
Content Engagement -
These metrics will help understand content investment strategy. Understanding which content consumers are watching more, and whether they are completing them will be the ultimate guides to content acquisition and to decisions regarding original content production (Hotstar Specials)
- Content Engagement - at a per user level
- Watch time per user
- Content completion rates
- Genre-specific engagement rates
-
Sports Viewership Metrics -
This is critical for maintaining Hotstar’s competitive edge in sports broadcasting. Peak concurrent viewers during live sports events may be a vanity metric, but it underlines the overall brand visibility of Hotstar, and can serve to reactivate dormant users.
Geographical breakdown of sports viewership
Cross-sectional Engagement
-
Platform Retention Rate
A classic cohort analysis by subscription type can reveal if customers are increasing their usage of Disney + Hotstar over time.
A consistent retention over 30-day, 90-day, and annual retention rates suggests that users are regularly deriving enjoyment from viewing Hotstar.
-
Cross-Platform Engagement
This helps optimize user experience across multiple platforms, and informs decisions on tech & UX.
- User activity across devices (mobile, web, smart TV)
- Session frequency and duration by platform
- Helps optimize user experience and platform development
- Guides technology investment decisions
Note: This case study is an exercise in understanding the metrics that a business like Disney + Hotstar would be tracking on a regular basis, and does not reflect actual adoption.