Customer Journey Analytics - Building a Pipeline for D2C
A Customer journey analytics pipeline can enable you to perform powerful analysis on your own
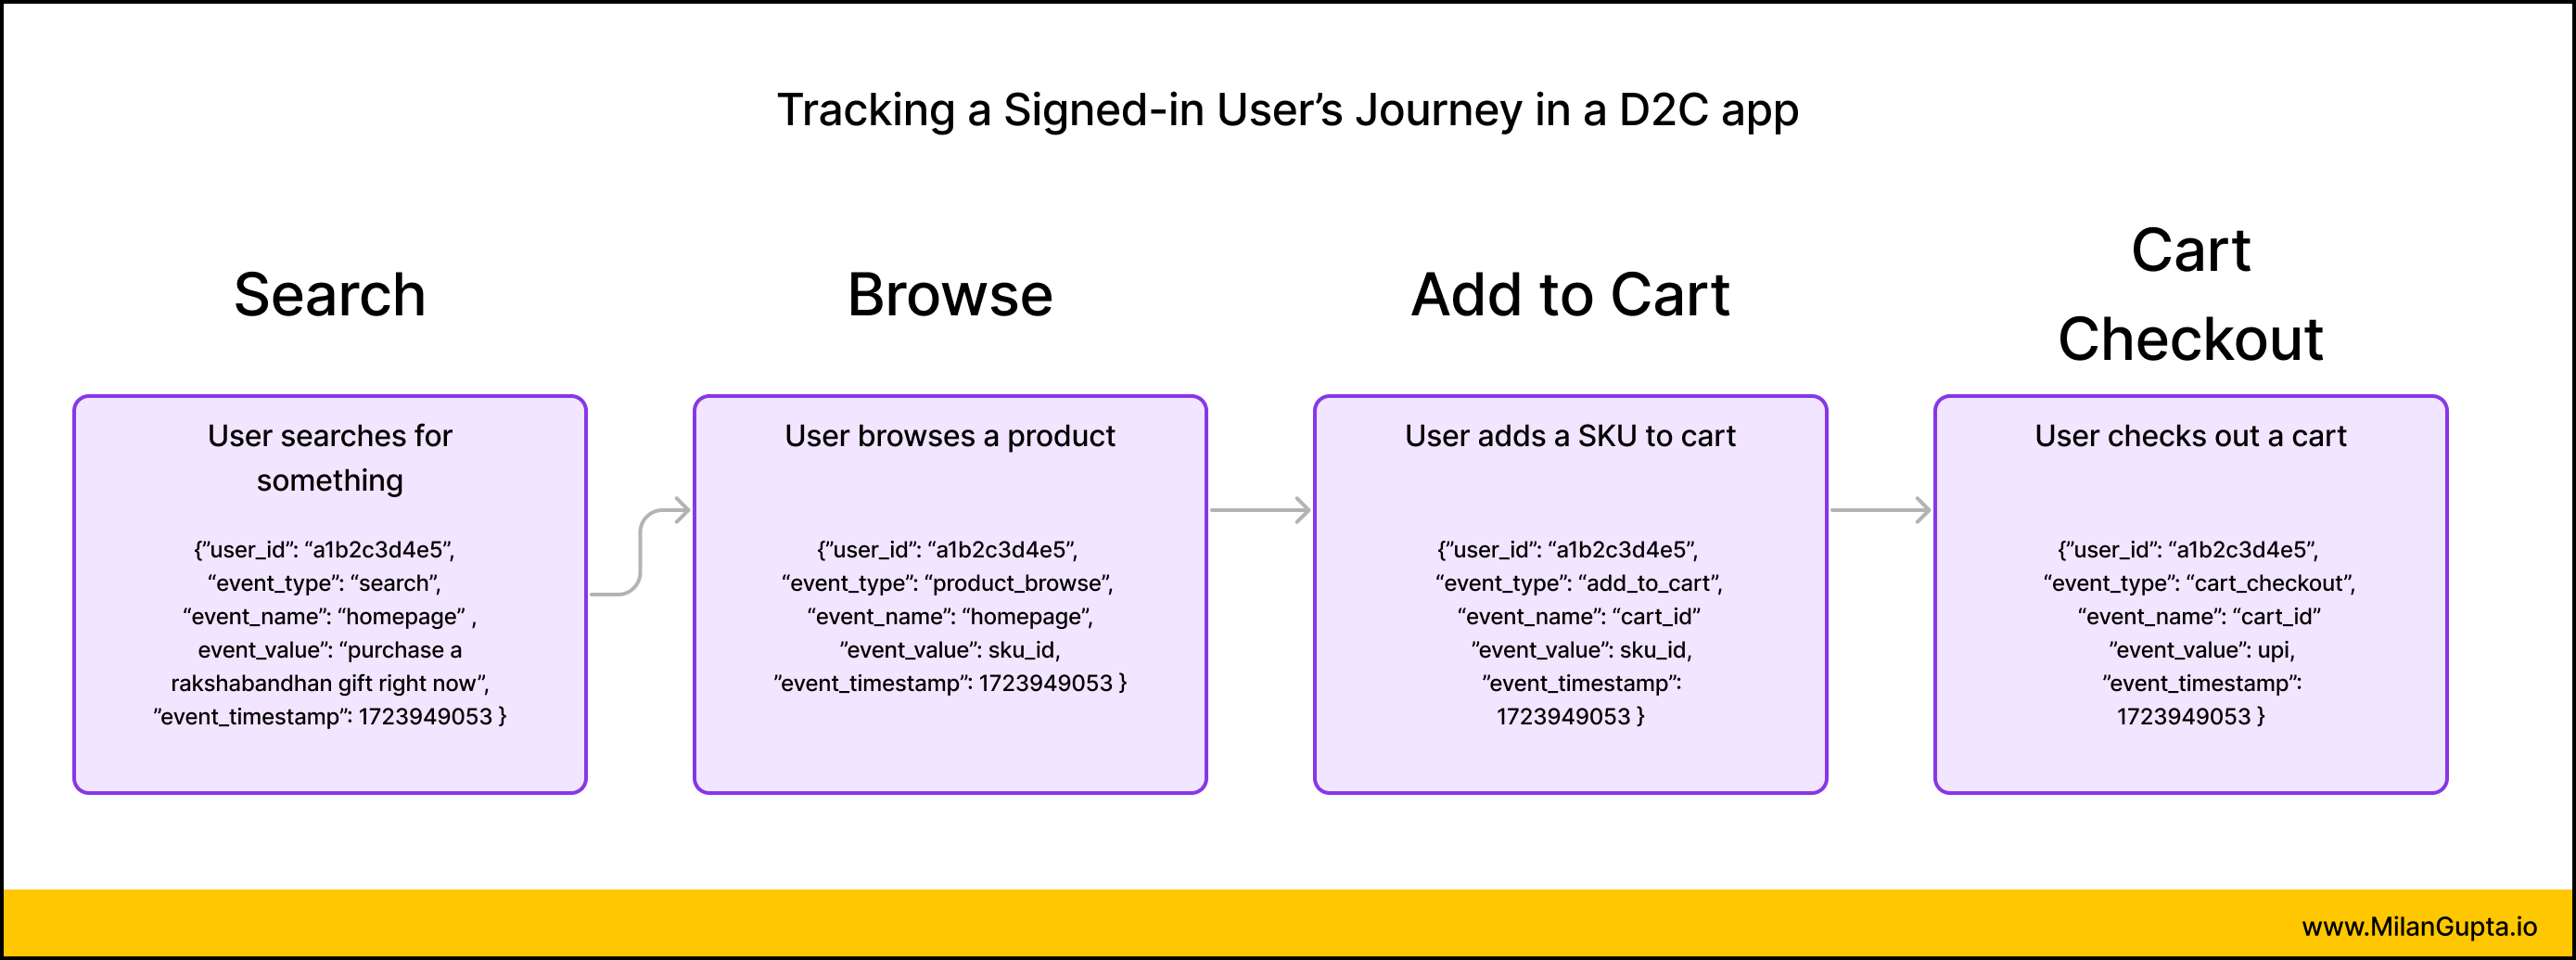
In this blogpost, we will take a high-level view at creating a first-party Customer Journey Analytics pipeline.
The single biggest advantage to building a first-party Analytics pipeline is that you own end-to-end customer data.
You can build out your own analytics pipeline exactly how you need it. All you would need is a flexible and opinionated architecture, and an understanding of the direction of business requirements.
To help illustrate this case, let’s consider the following problem statement:
You are the Product Head for GiftAway, a D2C brand that makes it super-easy for users to send gifts to their family. You want to understand the user funnel - from when the user visit your website for the first-time to when they checkout.
What is the Happy Flow for GiftAway?
- User searches for something - let’s say - “Rakhi gift hamper”
- User browses a product - a Rakhi, flowers & chocolate hamper
- User adds product to cart
- User checks out the cart
As Product Manager, you want to see the numbers down this funnel.

What are the types of data we collect?
- User profile data -
- When did the user signup for the first time,
- What is the user’s age,
- Is the user signed up to the loyalty program,
- Has the user completed a purchase,
- How many carts has the user checked out,
- What are the loyalty points that the user has got
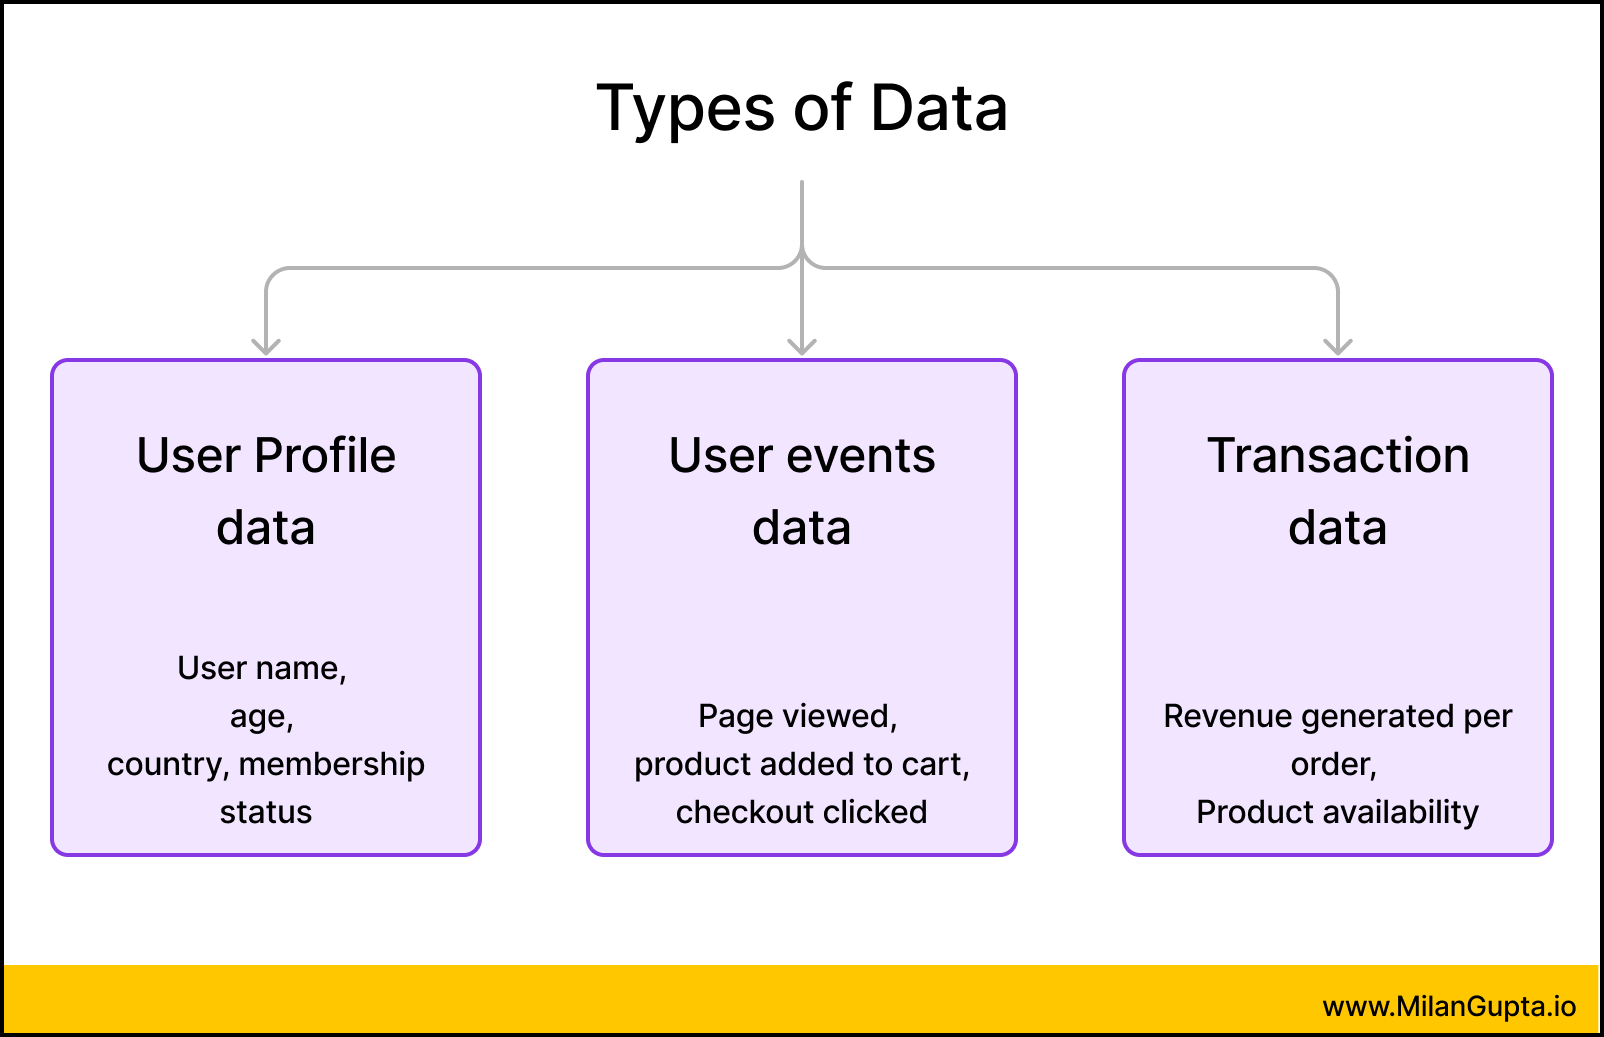
- User events data - here we track every scroll or click that a user does, and specially focus on actionable insights. For the purpose of our D2C app, we are focused specifically on the journey from Search to Browsing to Cart addition to Cart checkout. User event data is what we will use to create our acquisition-to-conversion funnel.
- User transactions & Product inventory data
- This is data that is stored in databases. These data have business value in their own right - for example carts_checkout contains data of customers who have checked-out products online. Being able to tie transaction data with funnel data will make our analysis richer, by tying our engagement metrics to revenue.
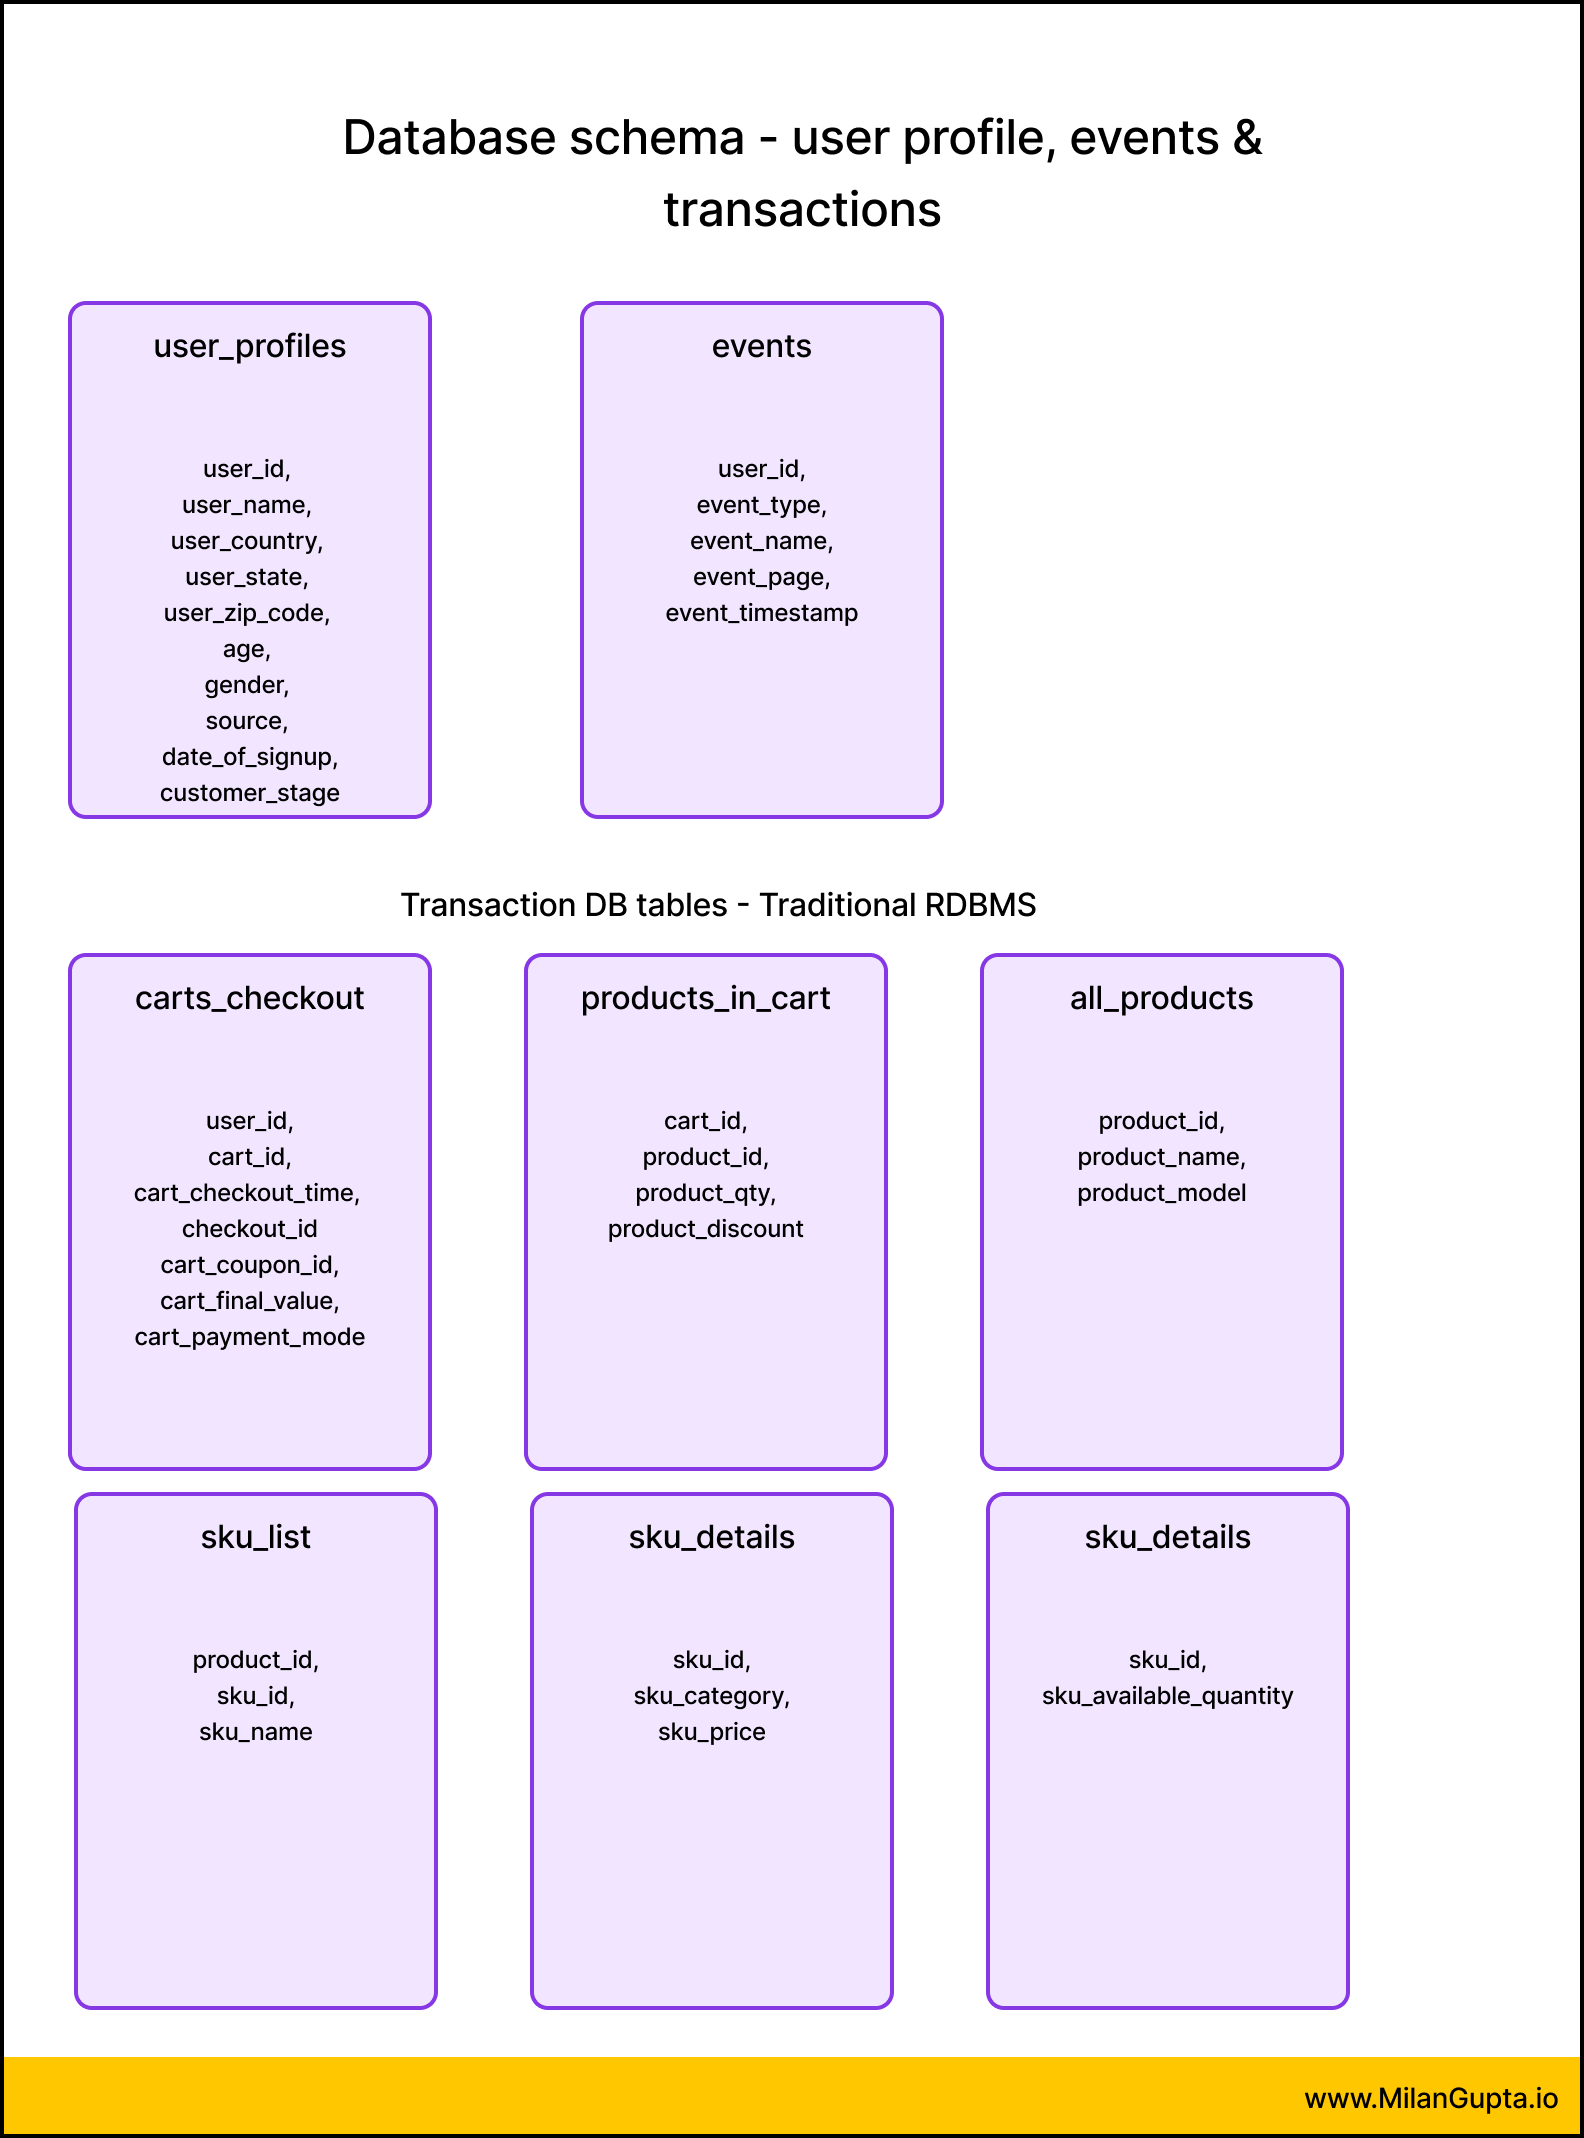
You own all your data with Customer Journey Analytics Pipeline
In a first-party analytics pipeline, all of the above - User profiles, User events and User transactions are owned and directly managed by the business.
Because the business has access to all raw data, there is a scope for unlimited analysis on the data.
If you are a super-big company having needs, it makes sense to build your own analytics pipeline. Additionally, if you are concerned about a third-party owning your data for privacy/ security reasons, again first-party Analytics pipeline comes into the picture.
However, First-Party Customer Journey Analytics is not easy
Building a first-party customer journey analytics pipeline takes dedicated specialists.
Also, driving insights from a first-party pipeline is not intuitive, and may often require dedicated Product analysts.
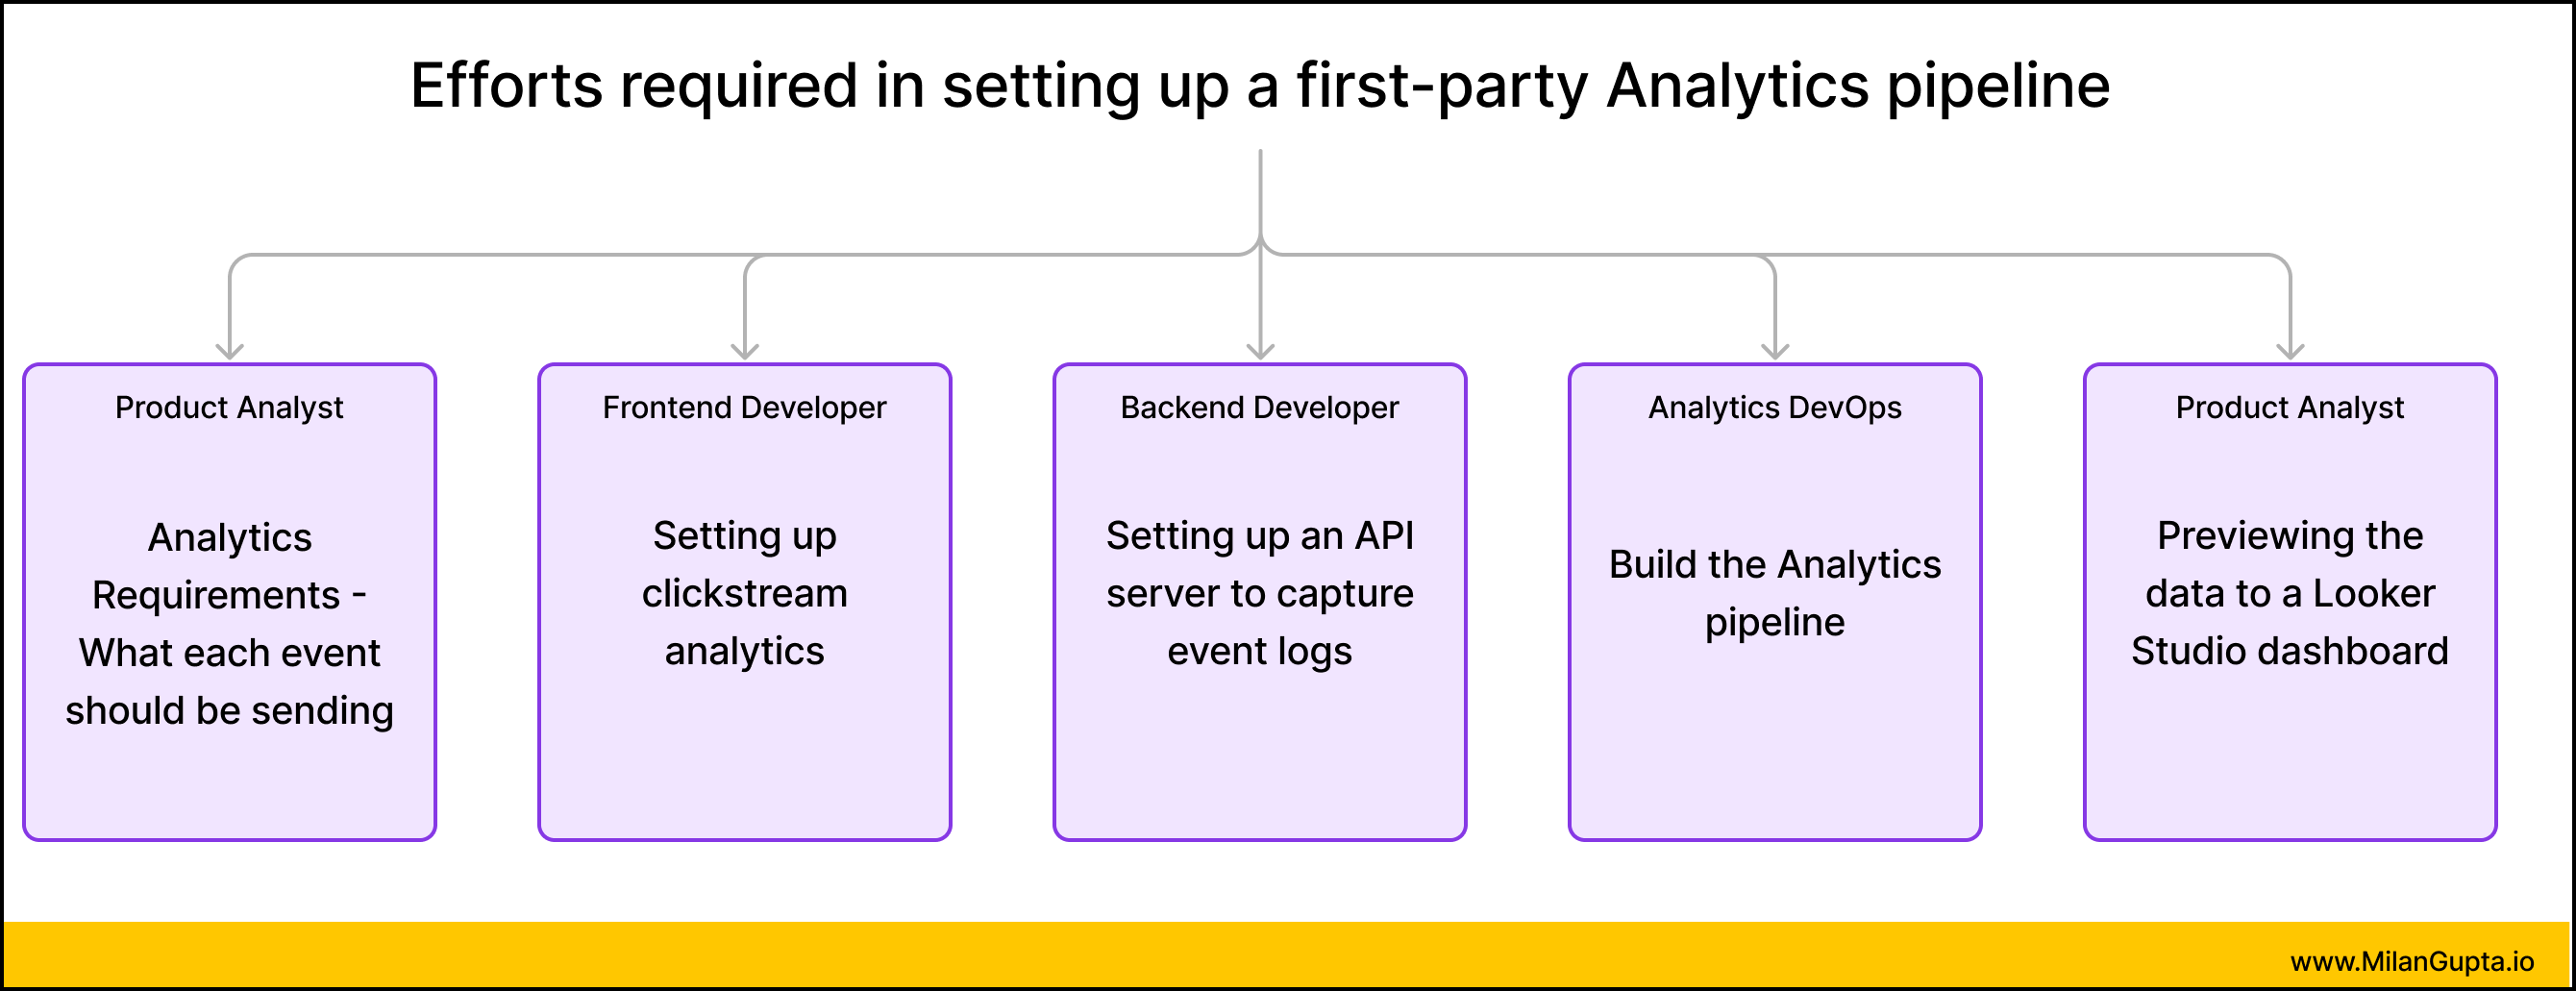
- Writing instrumentation logic in a manner that ensures you’re collecting the right data
- Coding in the instrumentation logic, so that the actual events get fired
- Building an API server
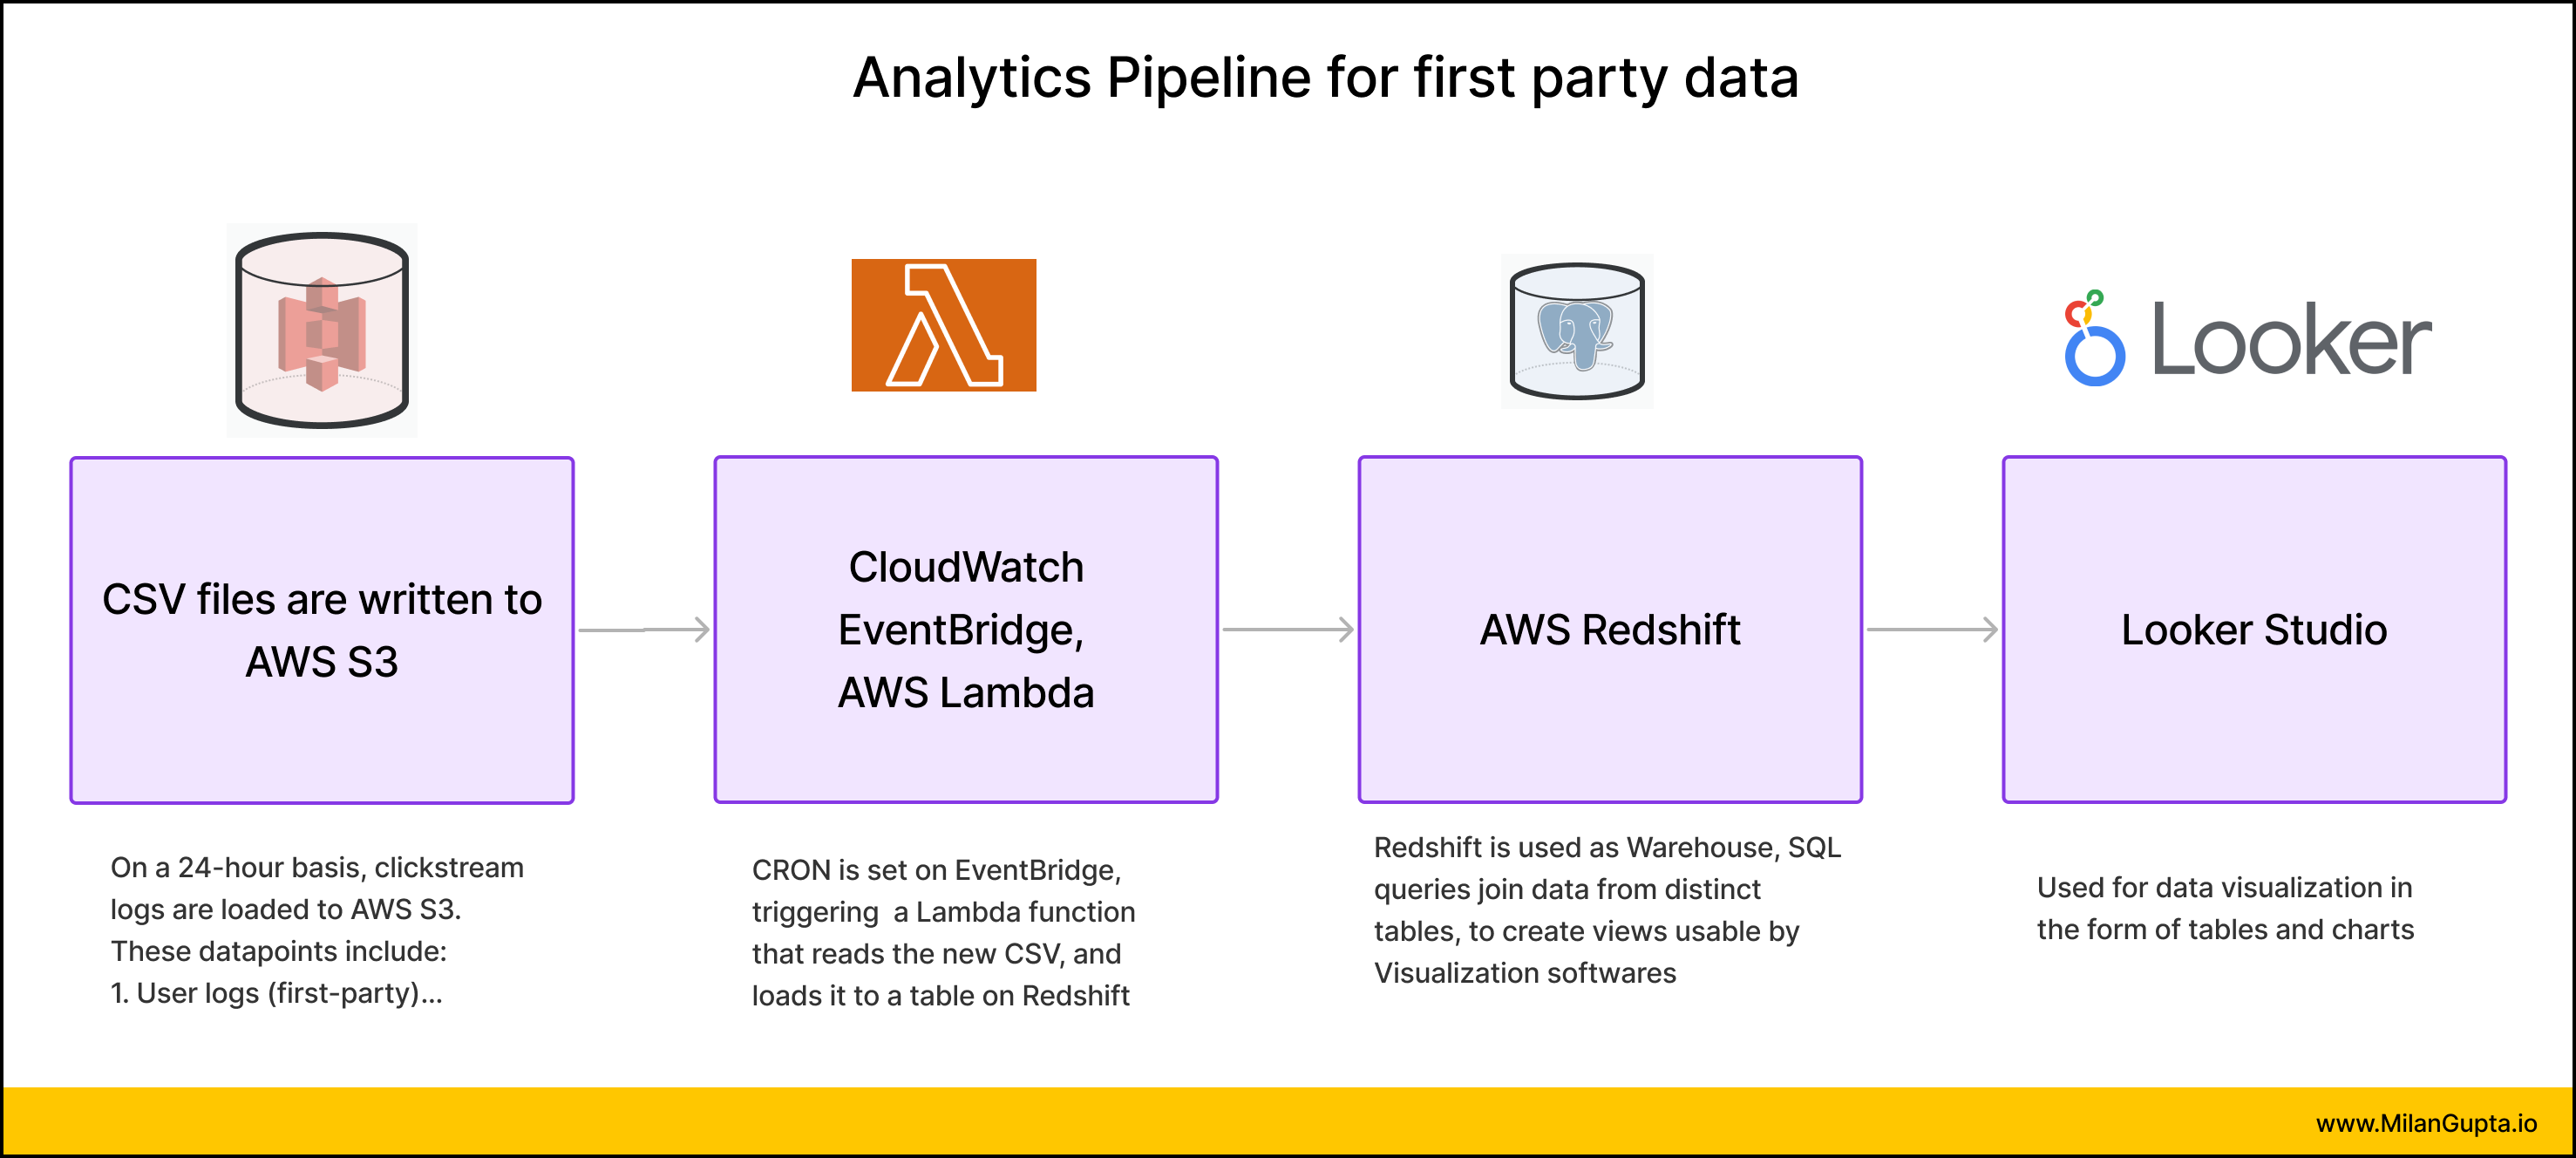
- Build the Analytics pipeline on the Cloud - from collection to loading and transformation to Viewing (ETL)
- Doing the right analysis
With First-Party Customer Journey Analytics platforms - time-to-insight is longer and requires skilled data teams
The reason Mixpanel and Amplitude are flourishing as Product analytics tools is that time-to-insight is incredibly quick.
These products have closely worked with product teams, and have in fact pioneered what analytics reports are most important. You need retention metrics - they’ll create a cohort-retention chart for you in a minute.
- What the analytics pipeline looks like
- Setting up an API & server for user events
- Writing to Data Lake (AWS S3)
- Loading to Warehouse
- Creating pre-view data on Warehouse
Google Analytics, Mixpanel & Amplitude are alternatives
Google Analytics - benefit - it is free to install. It is best for User acquisition - with Google being a major source of acquisition for a large variety of businesses.
While Google solves for the data collection layer, the visualization of insights is not something that Google is really interested in solving for - they just enable you to collect the data, and you can create visualizations using Looker Studio as and when you like.
Another major issue with Google Analytics is that you don’t get access to the raw data, and therefore you are limited to limited query powers of Looker Studio/ GA4 interface. You can’t run complex SQL queries, and save them as notebooks.
Mixpanel & Amplitude
These platforms are focused on enabling Product teams to run analytics
You can ask questions like:
- How many of queries related to “Rakshbandhan” led to actual conversions - numbers and percentage?
- How many users have ordered more than once in the last one year?
These platforms are focused on providing you answers to those questions.